Dead Simple Heatmaps with Leaflet and heatmap.js
TL;DR: The JSFiddle you can inspect for yourself. Continue reading for the walkthrough.
For a recent project I had to create a simple map with a heatmap. During development I tried a few mapping libraries and wanted to share how to do this with heatmap.js and their plugin for Leaflet.
The Data
To start, you’ll need some geocoded (has latitude and longitude) data. I’m using a subset of some property sales data for Baltimore that I recently compiled. If you’re interested in learning how to turn street addresses into lat/long coordinates, check out my article on using a free US Census Bureau tool to do just that.
Raw Data
lat      long      price
38.9615  -76.4875  140166
39.2005  -76.5685  154000
39.2175  -76.4795  435000
39.2175  -76.4805  219000
39.2215  -76.5875  23000
39.2215  -76.5885  37000
39.2215  -76.5945  18000
39.2225  -76.5875  20520
39.2225  -76.5885  56100
39.2225  -76.5895  37500
As JSON (Full Data File Here)
[
  {
    'lat': '39.2705',
    'lng': '-76.6165',
    'price': 120000
  },
  {
    'lat': '39.2705',
    'lng': '-76.6155',
    'price': 234500
  },
  ...
  {
    'lat': '39.2795',
    'lng': '-76.6075',
    'price': 487275
  }
]
The HTML
Bring in our data and the Leaflet library as well as some necessary leaflet styling. You must set the size of the map or it won’t show up.
<head>
    <link rel="stylesheet" href="http://cdn.leafletjs.com/leaflet/v0.7.7/leaflet.css" />
    <style>
        #map { width: 800px; height: 600px; }
    </style>
    <script src="http://cdn.leafletjs.com/leaflet/v0.7.7/leaflet.js"></script>
    <script src="/sales.js"></script>
</head>
Add a placeholder for our map and load in the heatmap.js library and it’s Leaflet plugin (in that order).
<body>
    <div id="map"></div>
    <script src="https://cdn.jsdelivr.net/npm/heatmapjs@2.0.2/heatmap.js"></script>
    <script src="https://cdn.jsdelivr.net/npm/leaflet-heatmap@1.0.0/leaflet-heatmap.js"></script>
    <script src="/sales.js"></script>
    <!-- our map code goes here -->
</body>
The JavaScript
Create the base Leaflet layer (the map itself)
let baseLayer = L.tileLayer(
    'http://{s}.tile.openstreetmap.org/{z}/{x}/{y}.png', {
        attribution: 'Map data © <a href="https://openstreetmap.org">OpenStreetMap</a>'
    }
)
Configure and create the heatmap.js layer. Check out the heatmap.js Leaflet plugin docs for additional configuration options.
let cfg = {
    "radius": 40,
    "useLocalExtrema": true,
    valueField: 'price'
};
let heatmapLayer = new HeatmapOverlay(cfg);
Determine min/max (from JSON data exposed as variable in sales.js) for the heatmap.js plugin
let min = Math.min(...sales.map(sale => sale.value))
let max = Math.max(...sales.map(sale => sale.value))
Create the overall Leaflet map using the two layers we created
let propertyHeatMap = new L.Map('map', {
    center: new L.LatLng(39.275, -76.613),
    zoom: 15,
    layers: [baseLayer, heatmapLayer]
})
Add data (from JSON data exposed as variable in sales.js) to the heatmap.js layer
heatmapLayer.setData({
min: min,
max: max,
data: sales
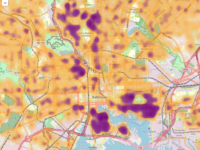
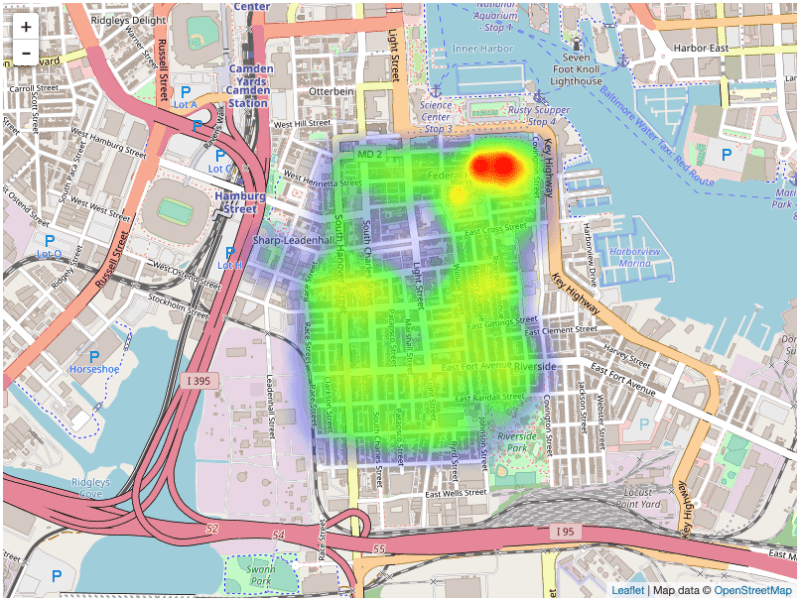
});And here we have it, a map showing a heatmap of sales figures for a neighborhood in Baltimore (Federal Hill area). Feel free to check out my article describing how this dataset was created or the tool I built to show this data for all of Baltimore.

And since Leaflet allows you to use any tile set that fits the OpenStreetMap format, you can play around with the base layer to make your heatmap exactly the way you want. The tile set below is called “Toner” created by a very talented group of designers at Stamen Design.
let baseLayer = L.tileLayer(
    'http://{s}.tile.stamen.com/toner/{z}/{x}/{y}.png', // Alternative tile set
)
I encourage you to play around with tile sets (just Google “openstreetmap tiles”) as there are a ton of great ones out there.