A D3.js Bar Chart for Today’s Web Applications
D3.js is awesome. For those with the imagination and experience, D3 can help to create some truly astounding visualizations.
The Legacy of D3
D3 has always been described as having a very large learning curve. Most of that comes from being born into a world largely unfamiliar with the concept of data binding. While this does conceptually separate the concerns of data manipulation from the actual DOM manipulation, the code itself is another story. Because D3 uses a technique called method chaining to configure all of its behavior, this data binding concept is difficult to separate in practice. Here’s a very small example that is only doing one part of the data binding:
d3.select('#viz')
  .selectAll('.bar')
  .data([8, 30, 83])
  .enter()
  .append('div')
  .attr('class', 'bar')
Notice that even in this small example, we’re also specifying the class of the divs responsible for representing a “bar”. Details like that should definitely live in a template. Even more, the necessary code blocks for an entire visualization can quickly become unmanageable.
A Better Way Today
This is where this article comes in. Reactive JavaScript frameworks like React and Vue have been around for a while now and it’s time to revisit what role D3 can play in today’s world.
To show this, I’m going to show how to create a simple bar chart using D3.js and Vue.js. There are some scenarios (e.g. animating hundreds of force-directed graph nodes) where this partnership begins to break down. But for the purposes of this post, letting Vue handle binding data to the DOM while leaning on D3 for all of its wonderful helper methods is a great combination. And while I’m using Vue.js, the same concepts can be applied to similar frameworks such as React and Angular.
Before I jump into the code examples, one note about using D3 for basic charts like this. Explore all your options while initially designing your visualization since in most cases D3 is overkill for things like line and bar charts. Unless you need to create a pixel-perfect match with a strict design or have uncommon requirements, using libraries such as Chart.js is a better way to go.
The Code
I’ll let you peruse the example on your own but there are a couple of important points:
- Most of the SVG elements are defined in the HTML ahead of time to maintain the separation between the JavaScript and DOM manipulation
- The only DOM manipulation done outside of Vue is when using D3 to automatically generate axes for the chart (highly recommended)
- All styling is done in the CSS (no D3 style, class, or attr calls)
Things to try next:
- Use a library like Tween to animate bars on page load
- Animate the data into the bar chart one day at a time
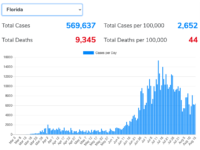
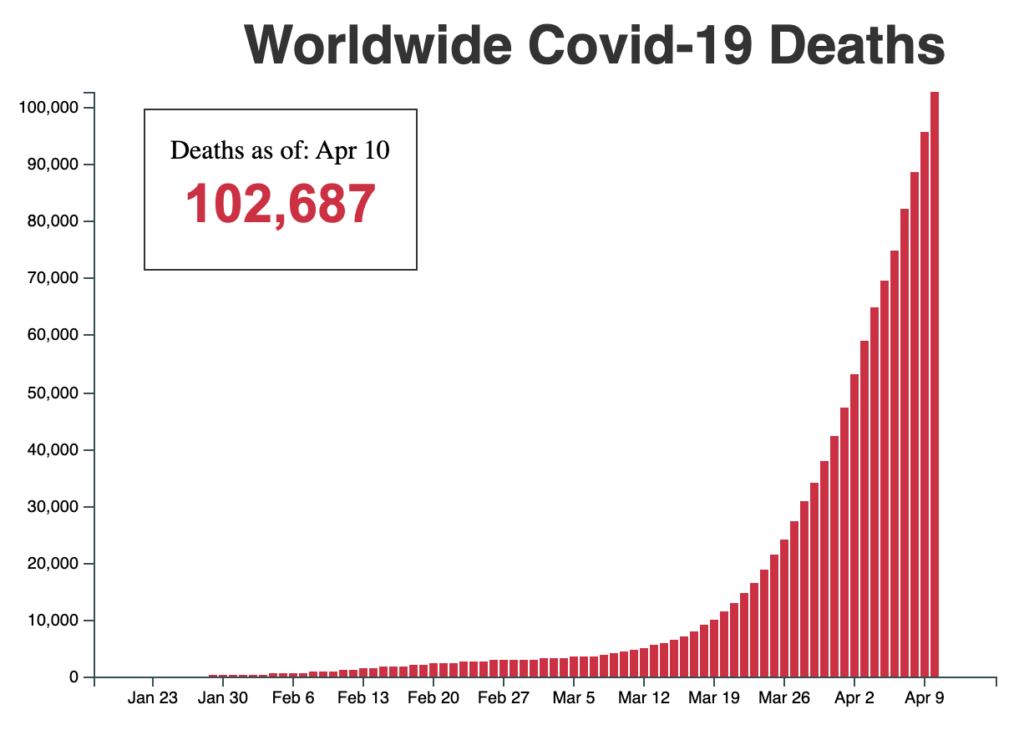
- Switch to a dynamic data source and automatically update the chart (bonus points if it’s something less depressing than Covid-19 deaths)
If I have time, I’ll have to do a future post showing how I would go about doing these.
Inspired by: CodePen for bar chart in Vue