Basic Maps with D3.js
I’ve seen dozens of articles and Blocks showing how to draw map with D3. What I have yet to find is a simple example for those just starting to learn D3. So here I am trying to fix that.
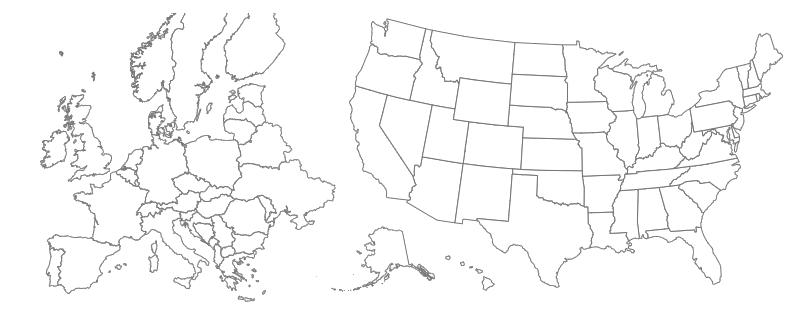
Since a good chunk of my readers are outside the US, the only non-basic thing I will show is how to create maps of more than just the United States.
TL;DR: Check out the fiddle here
Background
To create a map, there are two pieces you have to understand. First, you have data that describes all the boundaries on the map. Second, you need to understand how D3 uses that data to render the actual shapes.
For the data, we’ll be using a pretty standard format called GeoJSON. A quick search on Google will help you find pretty much any country/region/continent you’re interested in in GeoJSON format. I won’t go into detail about GeoJSON because this is meant to be a simple introduction. All you really need to know is that this JSON format consists of “features” which describe geographical information (e.g. like the outlines of states or countries). I’ll let you explore the GeoJSON if you wish:
- GeoJSON of state boundaries in the United States (found here)
- GeoJSON of country boundaries in Europe (found here)
Now on with the code…
The Code (also here)
// Setting up the svg element for D3 to draw in
let width = 500, height = 300

let svg = d3.select("body").append("svg")
    .attr("width", width)
    .attr("height", height)
// A projection tells D3 how to orient the GeoJSON features
let usaProjection = d3.geoAlbersUsa()
.scale(600)
.translate([250, 150])
let europeProjection = d3.geoMercator()
.center([ 13, 52 ])
.scale([ width / 1.5 ])
.translate([ width / 2, height / 2 ])// The path generator uses the projection to convert the GeoJSON
// geometry to a set of coordinates that D3 can understand
let pathGenerator = null
// URL to the GeoJSON itself
let geoJsonUrl = ''
let usa = true // Change to false to render Europe instead
if (usa) {
pathGenerator = d3.geoPath().projection(usaProjection)
geoJsonUrl = "https://gist.githubusercontent.com/spiker830/e0d1b7950ced31369c903bed0cead7b1/raw/702c72e0ca5a1be95f84a50a58cfa6d4d6400f3f/us_features.json"
} else {
pathGenerator = d3.geoPath().projection(europeProjection)
geoJsonUrl = "https://gist.githubusercontent.com/spiker830/3eab0cb407031bf9f2286f98b9d0558a/raw/7edae936285e77be675366550e20f9166bed0ed5/europe_features.json"
}// Request the GeoJSON
d3.json(geoJsonUrl).then(geojson => {
// Tell D3 to render a path for each GeoJSON feature
svg.selectAll("path")
.data(geojson.features)
.enter()
.append("path")
.attr("d", pathGenerator) // This is where the magic happens
.attr("stroke", "grey") // Color of the lines themselves
.attr("fill", "white") // Color uses to fill in the lines
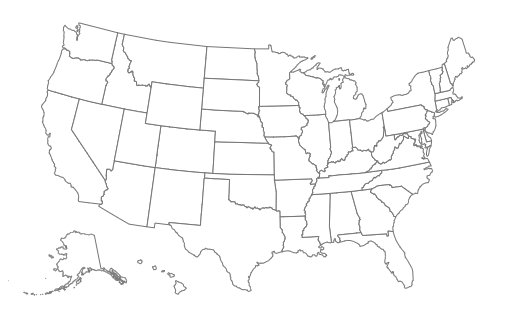
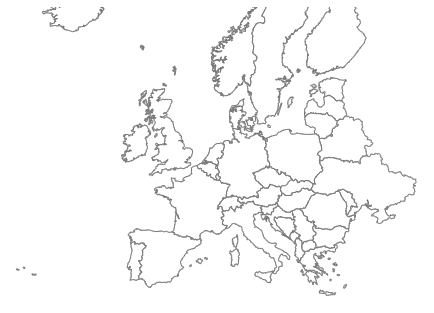
})And the result:
That’s It!
Now you know how to create maps in D3! Check out the fiddle if you ran into issues with the code above. Here are some ideas of things you can experiment with to learn more:
- Change the scaling of each projection (using the .scale() function)
- Experiment with other projections that D3 provides
- Learn how to add other elements to the map in my Choropleth article