Easy Choropleth Maps with Vue and D3
For all but the most dynamic visualizations (which require more optimized performance), Vue.js and D3.js make a great combination for presenting data in unique ways. The benefit of this pairing is that you can let Vue handle the data and DOM manipulation while D3 handles the harder stuff like geographic projections and color interpolation. Leveraging the reactive style of JavaScript development in frameworks like Vue allows you to bypass most of D3’s update pattern which for many is the most difficult concept in D3 to grasp. This article shows how you can easily create a choropleth (i.e. a map with differently shaded regions) using just such a separation of concerns between D3 and Vue.
Check out the JSFiddle for this article if you’re impatient 🙂
The Data to Map
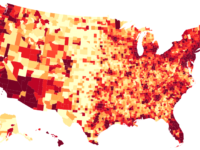
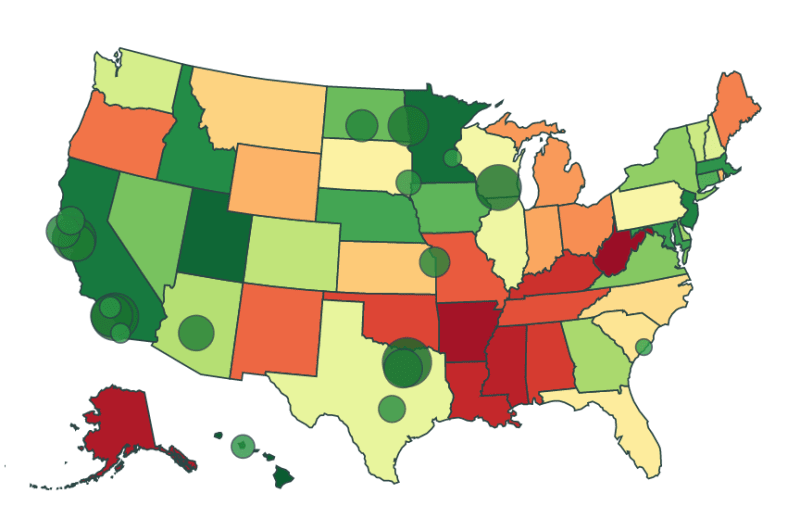
We’re going to generate a map of the United States showing the happiest places to live. I’m using two datasets for this choropleth, one ranking the states by happiness and the other listing the happiest cities. I encourage you to visit those links to see how they defined happiness and what underlying data they used to generate the rankings. For the city ranking, I’ve chosen to limit the dataset to the top 20 happiest cities to live.
// 20 happiest cities
[
  {"city":"Plano, TX","rank":1},
  {"city":"Irvine, CA","rank":2},
  {"city":"Madison, WI","rank":3},
  {"city":"Fremont, CA","rank":4},
  {"city":"Huntington Beach, CA","rank":5},
  {"city":"Fargo, ND","rank":6},
  {"city":"Grand Prairie, TX","rank":7},
  {"city":"San Jose, CA","rank":8},
  {"city":"Scottsdale, AZ","rank":9},
  {"city":"San Francisco, CA","rank":10},
  {"city":"Bismarck, ND","rank":11},
  {"city":"Overland Park, KS","rank":12},
  {"city":"Santa Rosa, CA","rank":13},
  {"city":"Austin, TX","rank":14},
  {"city":"Sioux Falls, SD","rank":15},
  {"city":"Pearl City, HI","rank":16},
  {"city":"Glendale, CA","rank":17},
  {"city":"San Diego, CA","rank":18},
  {"city":"St. Paul, MN","rank":19},
  {"city":"Charleston, SC","rank":20}
]
// States ranked by happiness
[
{"state": "HI", "rank": 1},
{"state": "UT", "rank": 2},
{"state": "MN", "rank": 3},
{"state": "CA", "rank": 4},
{"state": "NJ", "rank": 5},
{"state": "ID", "rank": 6},
{"state": "MA", "rank": 7},
{"state": "MD", "rank": 8},
{"state": "NE", "rank": 9},
{"state": "CT", "rank": 10},
{"state": "IA", "rank": 11},
{"state": "ND", "rank": 12},
{"state": "NV", "rank": 13},
{"state": "VA", "rank": 14},
{"state": "NY", "rank": 15},
{"state": "DE", "rank": 16 },
{"state": "GA", "rank": 17 },
{"state": "AZ", "rank": 18 },
{"state": "CO", "rank": 19 },
{"state": "VT", "rank": 20 },
{"state": "WA", "rank": 21 },
{"state": "NH", "rank": 22 },
{"state": "TX", "rank": 23 },
{"state": "IL", "rank": 24 },
{"state": "WI", "rank": 25 },
{"state": "PA", "rank": 26 },
{"state": "SD", "rank": 27 },
{"state": "FL", "rank": 28 },
{"state": "SC", "rank": 29 },
{"state": "NC", "rank": 30 },
{"state": "MT", "rank": 31 },
{"state": "KS", "rank": 32 },
{"state": "RI", "rank": 33 },
{"state": "WY", "rank": 34 },
{"state": "IN", "rank": 35 },
{"state": "MI", "rank": 36 },
{"state": "OH", "rank": 37 },
{"state": "ME", "rank": 38 },
{"state": "OR", "rank": 39 },
{"state": "NM", "rank": 40 },
{"state": "MO", "rank": 41 },
{"state": "TN", "rank": 42 },
{"state": "OK", "rank": 43 },
{"state": "AL", "rank": 44 },
{"state": "KY", "rank": 45 },
{"state": "LA", "rank": 46 },
{"state": "MS", "rank": 47 },
{"state": "AK", "rank": 48 },
{"state": "AR", "rank": 49 },
{"state": "WV", "rank": 50 }
]Location Data
There are two additional pieces of data we need to display the statistics above. First, we need the boundaries of each state so we can tell Vue to draw a path for each one. We also need lat/long data for each city in the ranking.
United States Outlines
The full US states GeoJSON file can be found here. This was originally found on this Block but can also be found from plenty of other sources. Here is an excerpt showing only Delaware:
{
    "type": "FeatureCollection",
    "features": [
        ...
        {
            "type": "Feature",
            "id": "DE",
            "properties": {"name": "Delaware"},
            "geometry": {
                "type": "Polygon",
                "coordinates":[[[-75.414089,39.804456],[-75.507197,39.683964],[-75.611259,39.61824],[-75.589352,39.459409],[-75.441474,39.311532],[-75.403136,39.065069],[-75.189535,38.807653],[-75.09095,38.796699],[-75.047134,38.451652],[-75.693413,38.462606],[-75.786521,39.722302],[-75.616736,39.831841],[-75.414089,39.804456]]]
            }
        }
        ...
    ]
}
City Locations
The latitude and longitude for each city was also pretty easy to find. I used a combination of this list of the most populous US cities and Wikipedia to compile this information and add it to the ranking above.
[
  {"city":"Plano, TX","rank":1,"lat":"33.05","lng":"-96.75"},
  {"city":"Irvine, CA","rank":2,"lat":"33.68","lng":"-117.77"},
  {"city":"Madison, WI","rank":3,"lat":"43.09","lng":"-89.43"},
  {"city":"Fremont, CA","rank":4,"lat":"37.50","lng":"-122.08"},
  {"city":"Huntington Beach, CA","rank":5,"lat":"33.69","lng":"-118.01"},
  {"city":"Fargo, ND","rank":6,"lat":"46.88","lng":"-96.79"},
  {"city":"Grand Prairie, TX","rank":7,"lat":"32.69","lng":"-97.02"},
  {"city":"San Jose, CA","rank":8,"lat":"37.30","lng":"-121.82"},
  {"city":"Scottsdale, AZ","rank":9,"lat":"33.68","lng":"-111.86"},
  {"city":"San Francisco, CA","rank":10,"lat":"37.73","lng":"-123.03"},
  {"city":"Bismarck, ND","rank":11,"lat":"46.81","lng":"-100.78"},
  {"city":"Overland Park, KS","rank":12,"lat":"38.89","lng":"-94.69"},
  {"city":"Santa Rosa, CA","rank":13,"lat":"38.45","lng":"-122.71"},
  {"city":"Austin, TX","rank":14,"lat":"30.30","lng":"-97.75"},
  {"city":"Sioux Falls, SD","rank":15,"lat":"43.54","lng":"-96.73"},
  {"city":"Pearl City, HI","rank":16,"lat":"21.41","lng":"-157.97"},
  {"city":"Glendale, CA","rank":17,"lat":"34.15","lng":"-118.26"},
  {"city":"San Diego, CA","rank":18,"lat":"32.82","lng":"-117.13"},
  {"city":"St. Paul, MN","rank":19,"lat":"44.95","lng":"-93.10"},
  {"city":"Charleston, SC","rank":20,"lat":"32.82","lng":"-79.96"}
]
The Code
The JavaScript
The Vue component is pretty straightforward and based entirely on computed properties for both the geo and happiness data. The created lifecycle hook is just used to get the GeoJSON loaded into the component.
new Vue({
  el: "#app",
  data: {
    statesJson: null,
    happiestCities: [], // Shown above and in JSFiddle
    happiestStates: [] // Shown above and in JSFiddle
  },
  computed: {
    // Typical projection for showing all states scaled and positioned appropriately
    projection () {
      return d3.geoAlbersUsa().scale(600).translate([250, 150])
    },

    // Function for converting GPS coordinates into path coordinates
    pathGenerator () {
      return d3.geoPath().projection(this.projection)
    },

    // Combine the states GeoJSON with a rank-based gradient
    stateData () {
      return this.statesJson ? this.statesJson.features.map(feature => {
        let state = this.happiestStates.find(state => state.state === feature.id)
        return {
          feature,
          color: this.stateColor(state.rank)
        }
      }) : []
    },

    // Construct the city data to be used by the circle elements
    cityData () {
      return this.happiestCities.map(city => {
        return {
          city: city.city,
          x: this.projection([city.lng, city.lat])[0],
          y: this.projection([city.lng, city.lat])[1],
          color: this.cityColor(city.rank),
          size: this.citySize(city.rank)
        }
      })
    },

    // Interpolate from red to green in the domain 50 to 1 (our ranking)
    stateColor () {
      return d3.scaleSequential().domain([50, 1]).interpolator(d3.interpolateRdYlGn);
    },

    // Interpolate between two green colors for the happiest cities
    cityColor () {
      return d3.scaleLinear().domain([20, 1]).range(['#32a852', '#10732b'])
    },

    // Interpolate between two sizes for the happiest cities
    citySize () {
      return d3.scaleLinear().domain([20, 1]).range([5, 15])
    }
  },

  // On creation, get the GeoJSON
  created () {
    axios.get('https://api.github.com/gists/e0d1b7950ced31369c903bed0cead7b1')
      .then(response => {
      this.statesJson = JSON.parse(response.data.files['us_features.json'].content)
    })
      .catch(error => {
      console.log(error)
    })
  }
})
The HTML
With most of the data mangling handled by Vue, the HTML is dead simple. Essentially, an SVG path is generated and filled for each state and an SVG circle is drawn and filled for each city.
<div id="app">
  <svg ref="svg" height="300" width="500">
    <path
      v-for="state in stateData"
      :key="state.feature.id"
      :d="pathGenerator(state.feature)"
      :style="{
        fill: state.color,
        stroke: 'darkslategray'
      }"
    />
    <circle
      v-for="city in cityData"
      :key="city.city"
      :cx="city.x"
      :cy="city.y"
      :r="city.size"
      :style="{
        fill: city.color,
        stroke: 'darkslategray',
        opacity: 0.8
      }"
    ></circle>
  </svg>
</div>
And below is the result. Use the JSFiddle for this happiness map for reference or if you have any issues. If you want to go further with this choropleth using Vue and D3, my suggestion is to start with adding a tooltip which shows the ranking information for each city and state. You can get some ideas from block referenced below or one of the many other examples out there.
Also, if you really like maps, be sure to check out my articles on creating heatmaps with heatmap.js and Leaflet and programmatically getting the latitude and longitude for an address.